LOGGER – The Introductory Overview
Here in this blog we will know about how to do the WCS Logs Configuration. Logs are the footprints left behind while running the application. It is one of the mandatory step followed during software development. It consists of chunks of statement which is being printed in a file during execution of the program. We call this file as LOG file.
Logs can be used for either way to print the exception statement or informative statement. We use to put logger statements in our file to get an idea like what is happening during the execution of program. It is advisable to put loggers for both happy and exceptional flow.

Mamaearth brings you 100% toxin-free and safe skincare products that are formulated with love and the goodness of natural ingredients. These are Asia’s First MadeSafe Certified Brand in India.
SHOP ON
LOGGER – The Implementation Overview
While developing our application we should keep in mind that we are using loggers. We can’t print the whole lot of information on each execution of program. The reason is like it will fill up our server space. And also it lowers down the performance as the server time is being utilized in reading and printing those loggers. To avoid this problem the WCS Framework comes with predefined severity levels. We need to use these levels wisely.
Loggers Severity Levels:
OFF : Logging is turned off and no events are being logged.
FATAL : Task cannot be continued. The component, application and server cannot function.
SEVERE : Task cannot be continued but component, application and server can still function.
This level can also indicate an forthcoming unrecoverable error.
WARNING: Potential error or forthcoming error. This level can also indicate a progressive failure (for example, the potential leaking of resources).
AUDIT : Significant event affecting server state or resources.
INFO : It is the general information outlining overall task progress.
CONFIG : It indicates any configuration change or its status.
DETAIL : It is the general information with detailed subtask progress.
FINE : Trace information – General trace + method entry, exit, and return values
FINER : Trace information – Detailed trace
FINEST : Trace information – A more detailed trace that includes all the detail that is needed to debug problems
ALL : It means all events are logged and can provide a more detailed trace than finest.
LOGGER – The Troubleshoot Overview
Since we had added the loggers to the code but we should be knowing the way how to check those logs. When we install WebSphere Application Server (WAS) then we get a separate package view. From here we can do all the server related configurational changes. We call it as WebSphere Application Server (WAS) Admin Console.
There are two ways to access WAS Admin Console:
1) By hitting the URL directly in browser:
syntax :
https://<hostname>:<adminSecurePort>/ibm/console/login.do
hostname : The fully qualified hostname or the IP address of the computer.
adminSecurePort : Supply the WebSphere Application Server Administration secure port.

Default URL for the WebSphere Application Server (WAS) Admin Console
Example :
https://localhost:9043/ibm/console/login.do
or
https://localhost:9060/ibm/console/login.do
2) By clicking on the local server in RAD:
Right click on local server, find the option ‘Administration‘. There we can see ‘Run Administration Console‘, click on to open the console view.
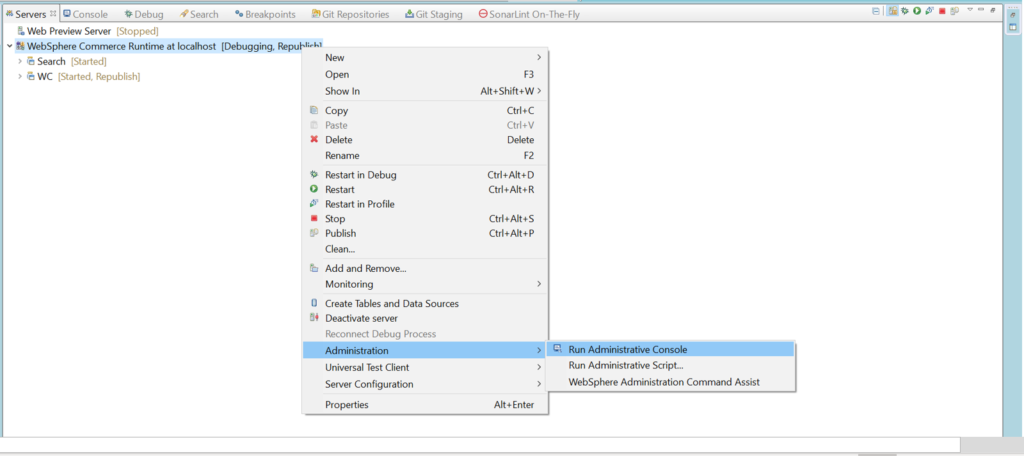
Steps to enable the logs:
Either of the option we can use to open WAS Console.
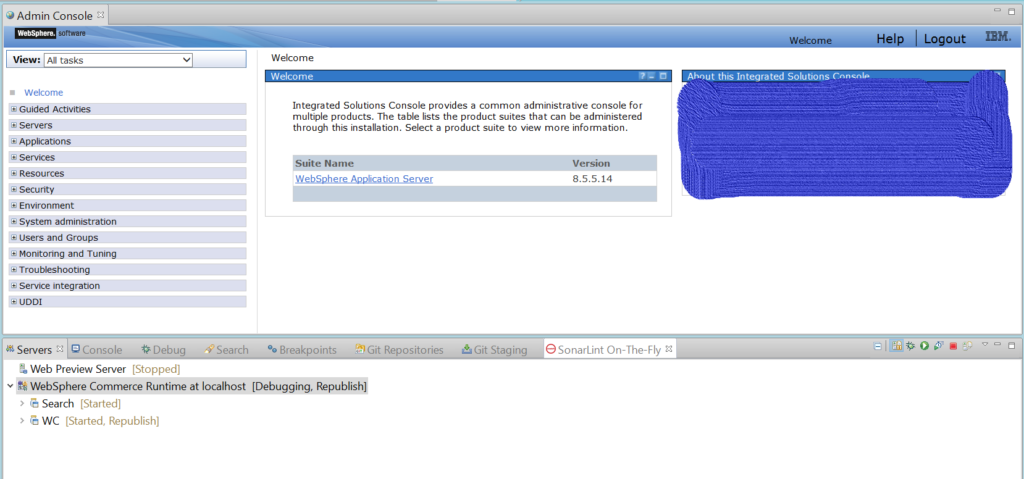
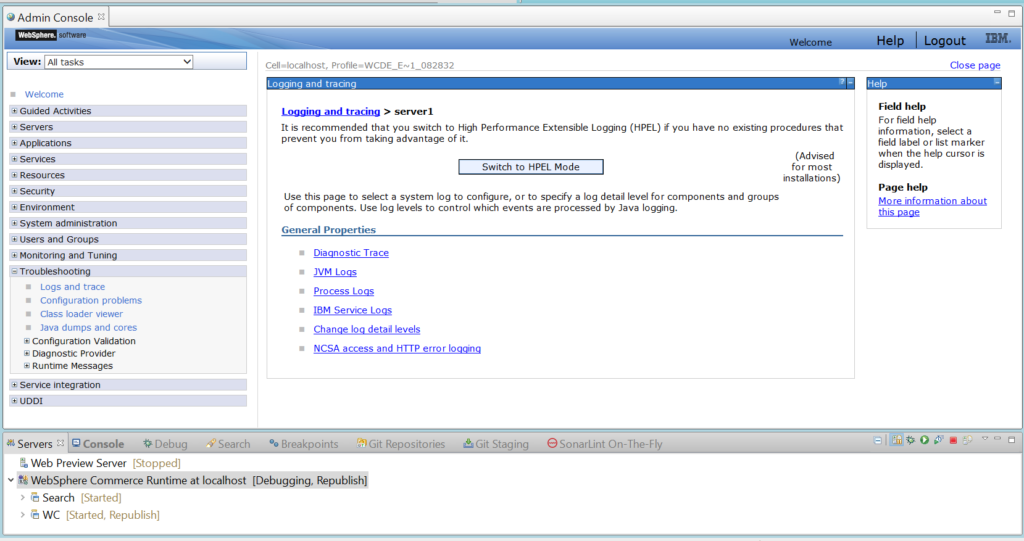
1) Click on ‘Troubleshooting‘ action menu present at the left panel of the page and select ‘Logs and trace‘
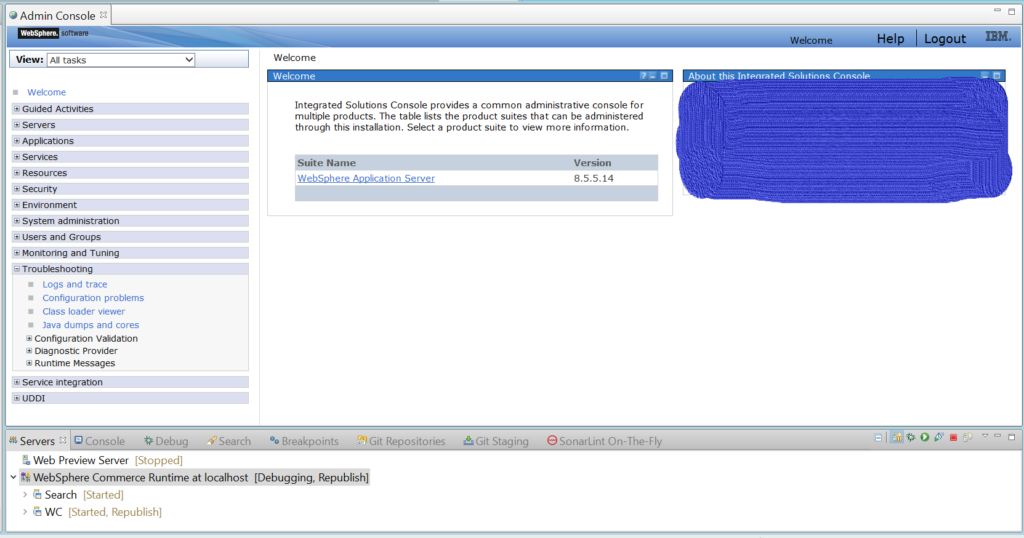
2) It will now show the installed local server (i.e. server1) . Click on highlighted ‘server1‘
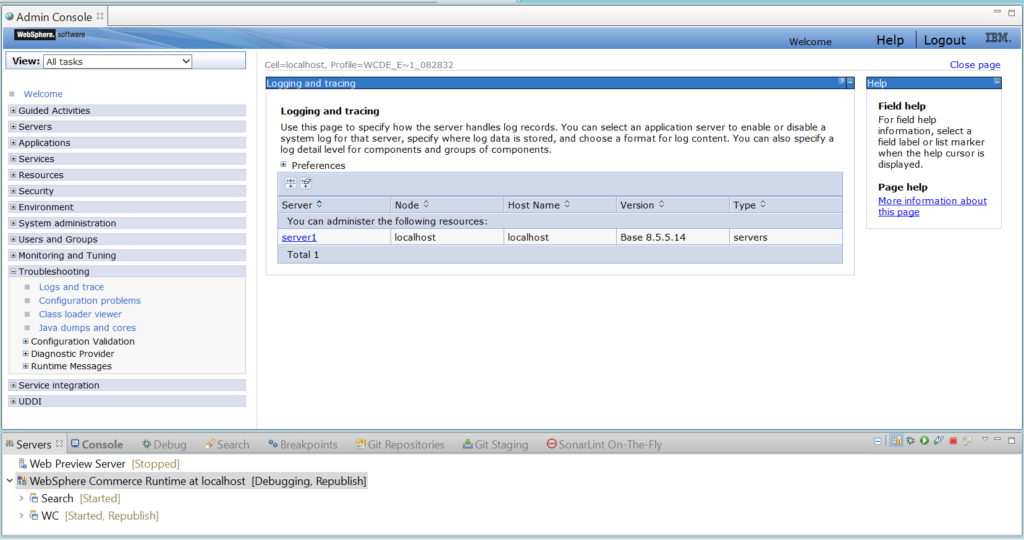
3) We get multiple ways to work on logs among those we have to choose ‘Change log detail levels‘.
4) After landing on this page we see there are two tabs one is ‘Configuration‘ and other is ‘Runtime‘.
Configuration : Choose this tab to make your logger enable permanently. Changes made to this tab are stored on the file system and applied when the server restarts.
Runtime : Choose this tab to make your logger enable only during the debug period. Modifications to this tab are applied immediately. Server restart is not required, if we do so then the changes will goes off.
Note: If we are making our log level changes for Runtime and want to make it for Configuration as well then select the radio button i.e. Save runtime changes to configuration as well and save the changes.
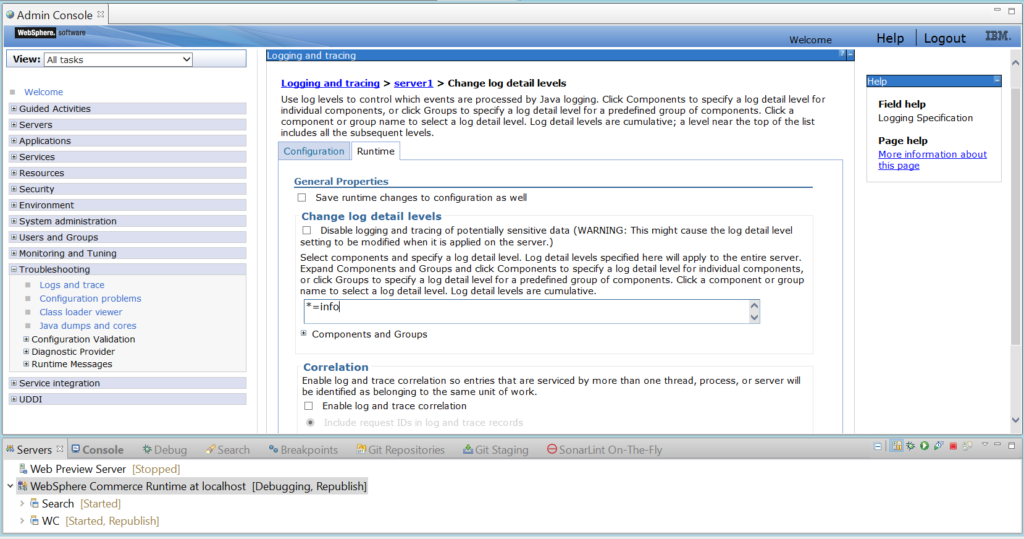
5) As per the above screen we can see the logger level is ‘info‘. It means all logs will be printed in log file whose severity level is defined as ‘info‘. If we want logs only for specific file then click on the [+] symbol button i.e. ‘Components and Groups‘.
Here it will open packages and inside that we can open respective files. Click on the file to set the tracing levels. Click on ‘Message and Trace Levels‘ and select the severity levels. Once you confirms the severity level, that trace will be added to the above trace log box.
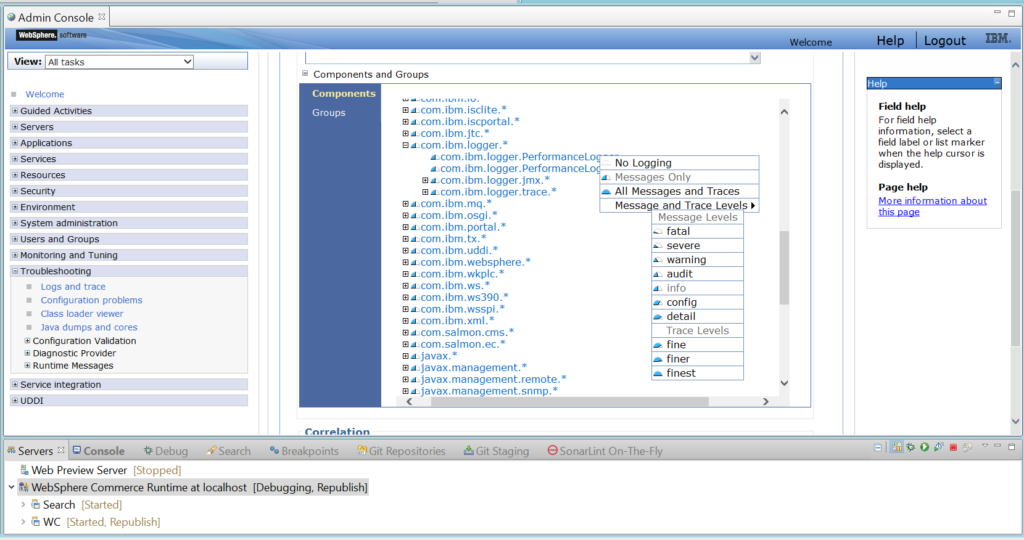
6) Below are the trace box looks like after the selection of severity levels. Here all the file traces are separated by colon(:). If we want to put trace logs for everything present inside particular file/folder then put it asterisk(*)
com.ibm.commerce.foundation.logging.* — It means traces are enabled for all files/folder present inside logging folder.
*=info: com.ibm.websphere.commerce.WC_SERVER=all: com.ibm.websphere.commerce.WC_USER=all:
com.ibm.websphere.commerce.WC_ACCESSCONTROL=all: com.ibm.commerce.foundation.logging.*=all
7) Finally at the end click on ‘Apply‘, ‘Save‘ and then ‘OK‘ to save our trace log changes.
8) Now run the RAD in debug mode and hit the site functionality. Logs will be printed in the trace.log file. Goto file location and check the log statements.
Trace Logs Location:
C:\WCS\IBM\WCDE_ENT70\wasprofile\logs\server1